Irrigation withdrawals and groundwater levels
By Marie Krausnick
Assistant General Manager
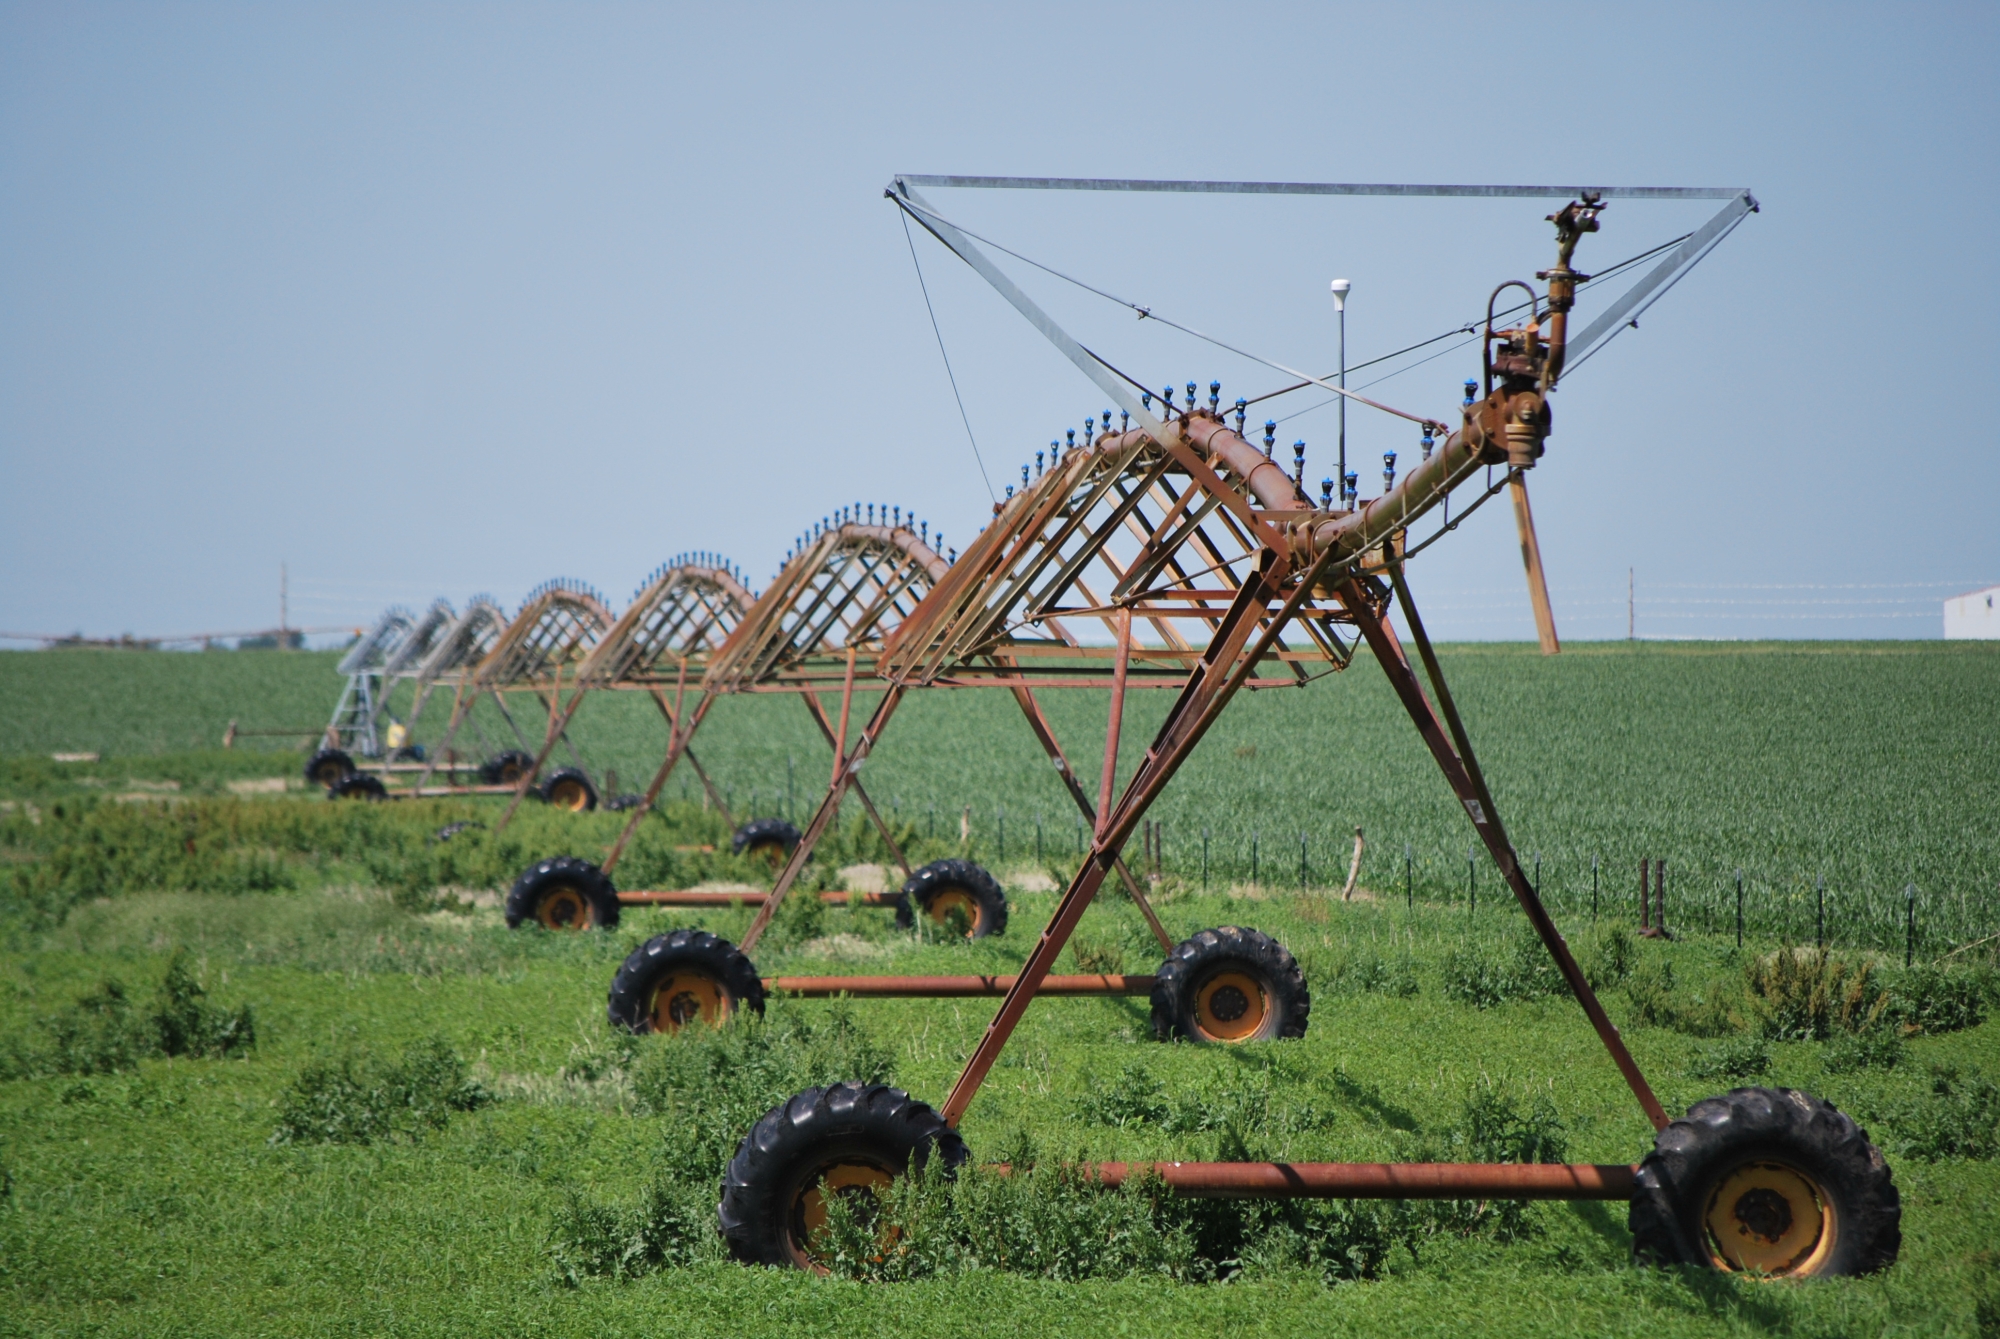
Irrigation plays a vital role in Nebraska’s agriculture. This is especially apparent in the Upper Big Blue Natural Resources District, which is the most heavily groundwater irrigated district in the state. In this district, 1.2 million acres are irrigated farmland, representing more than 12,000 active irrigation wells. However, irrigation can also put a strain on the area’s water resources when rainfall amounts aren’t enough to support a growing crop and irrigators turn to groundwater to fill the gap.
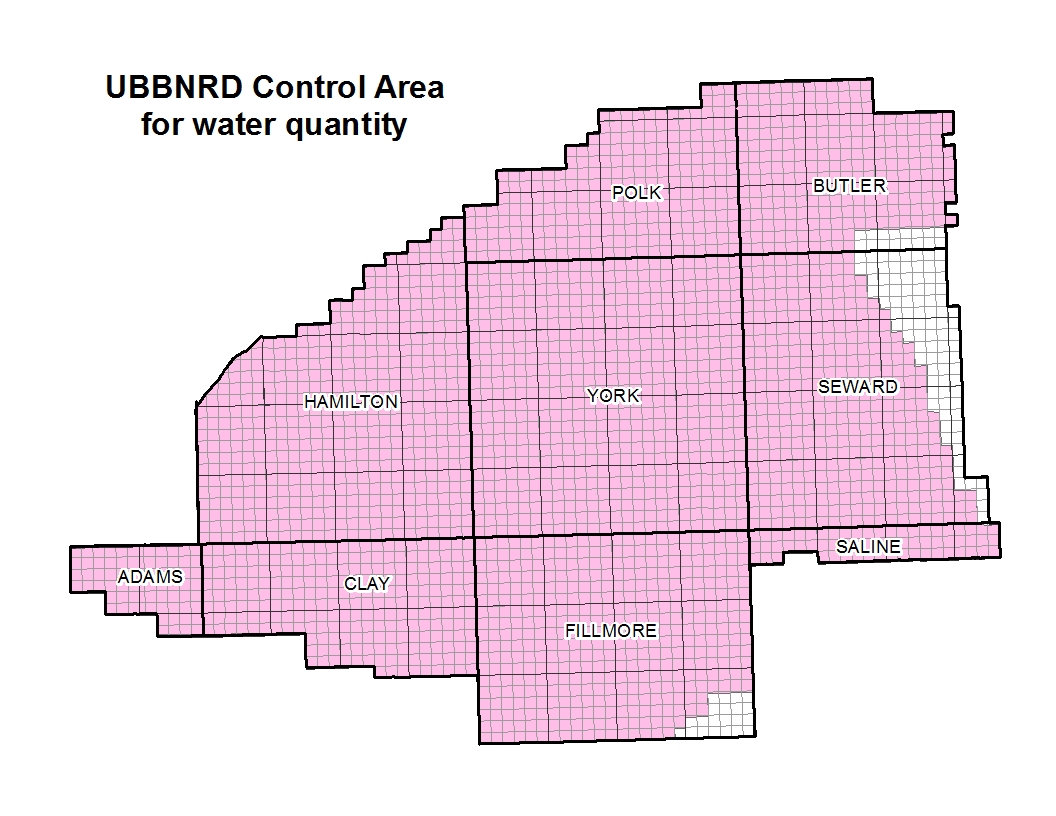
The district measures the groundwater levels each spring to determine the change from season to season. This spring the static water levels are below last spring by 2.21 feet, which is 6.68 feet above the allocation trigger. This trigger point was set by the board and is three feet above the lowest levels recorded in 1978. If the trigger point is reached in Control Area #1 (see map), the Board of Directors will vote to implement allocation.
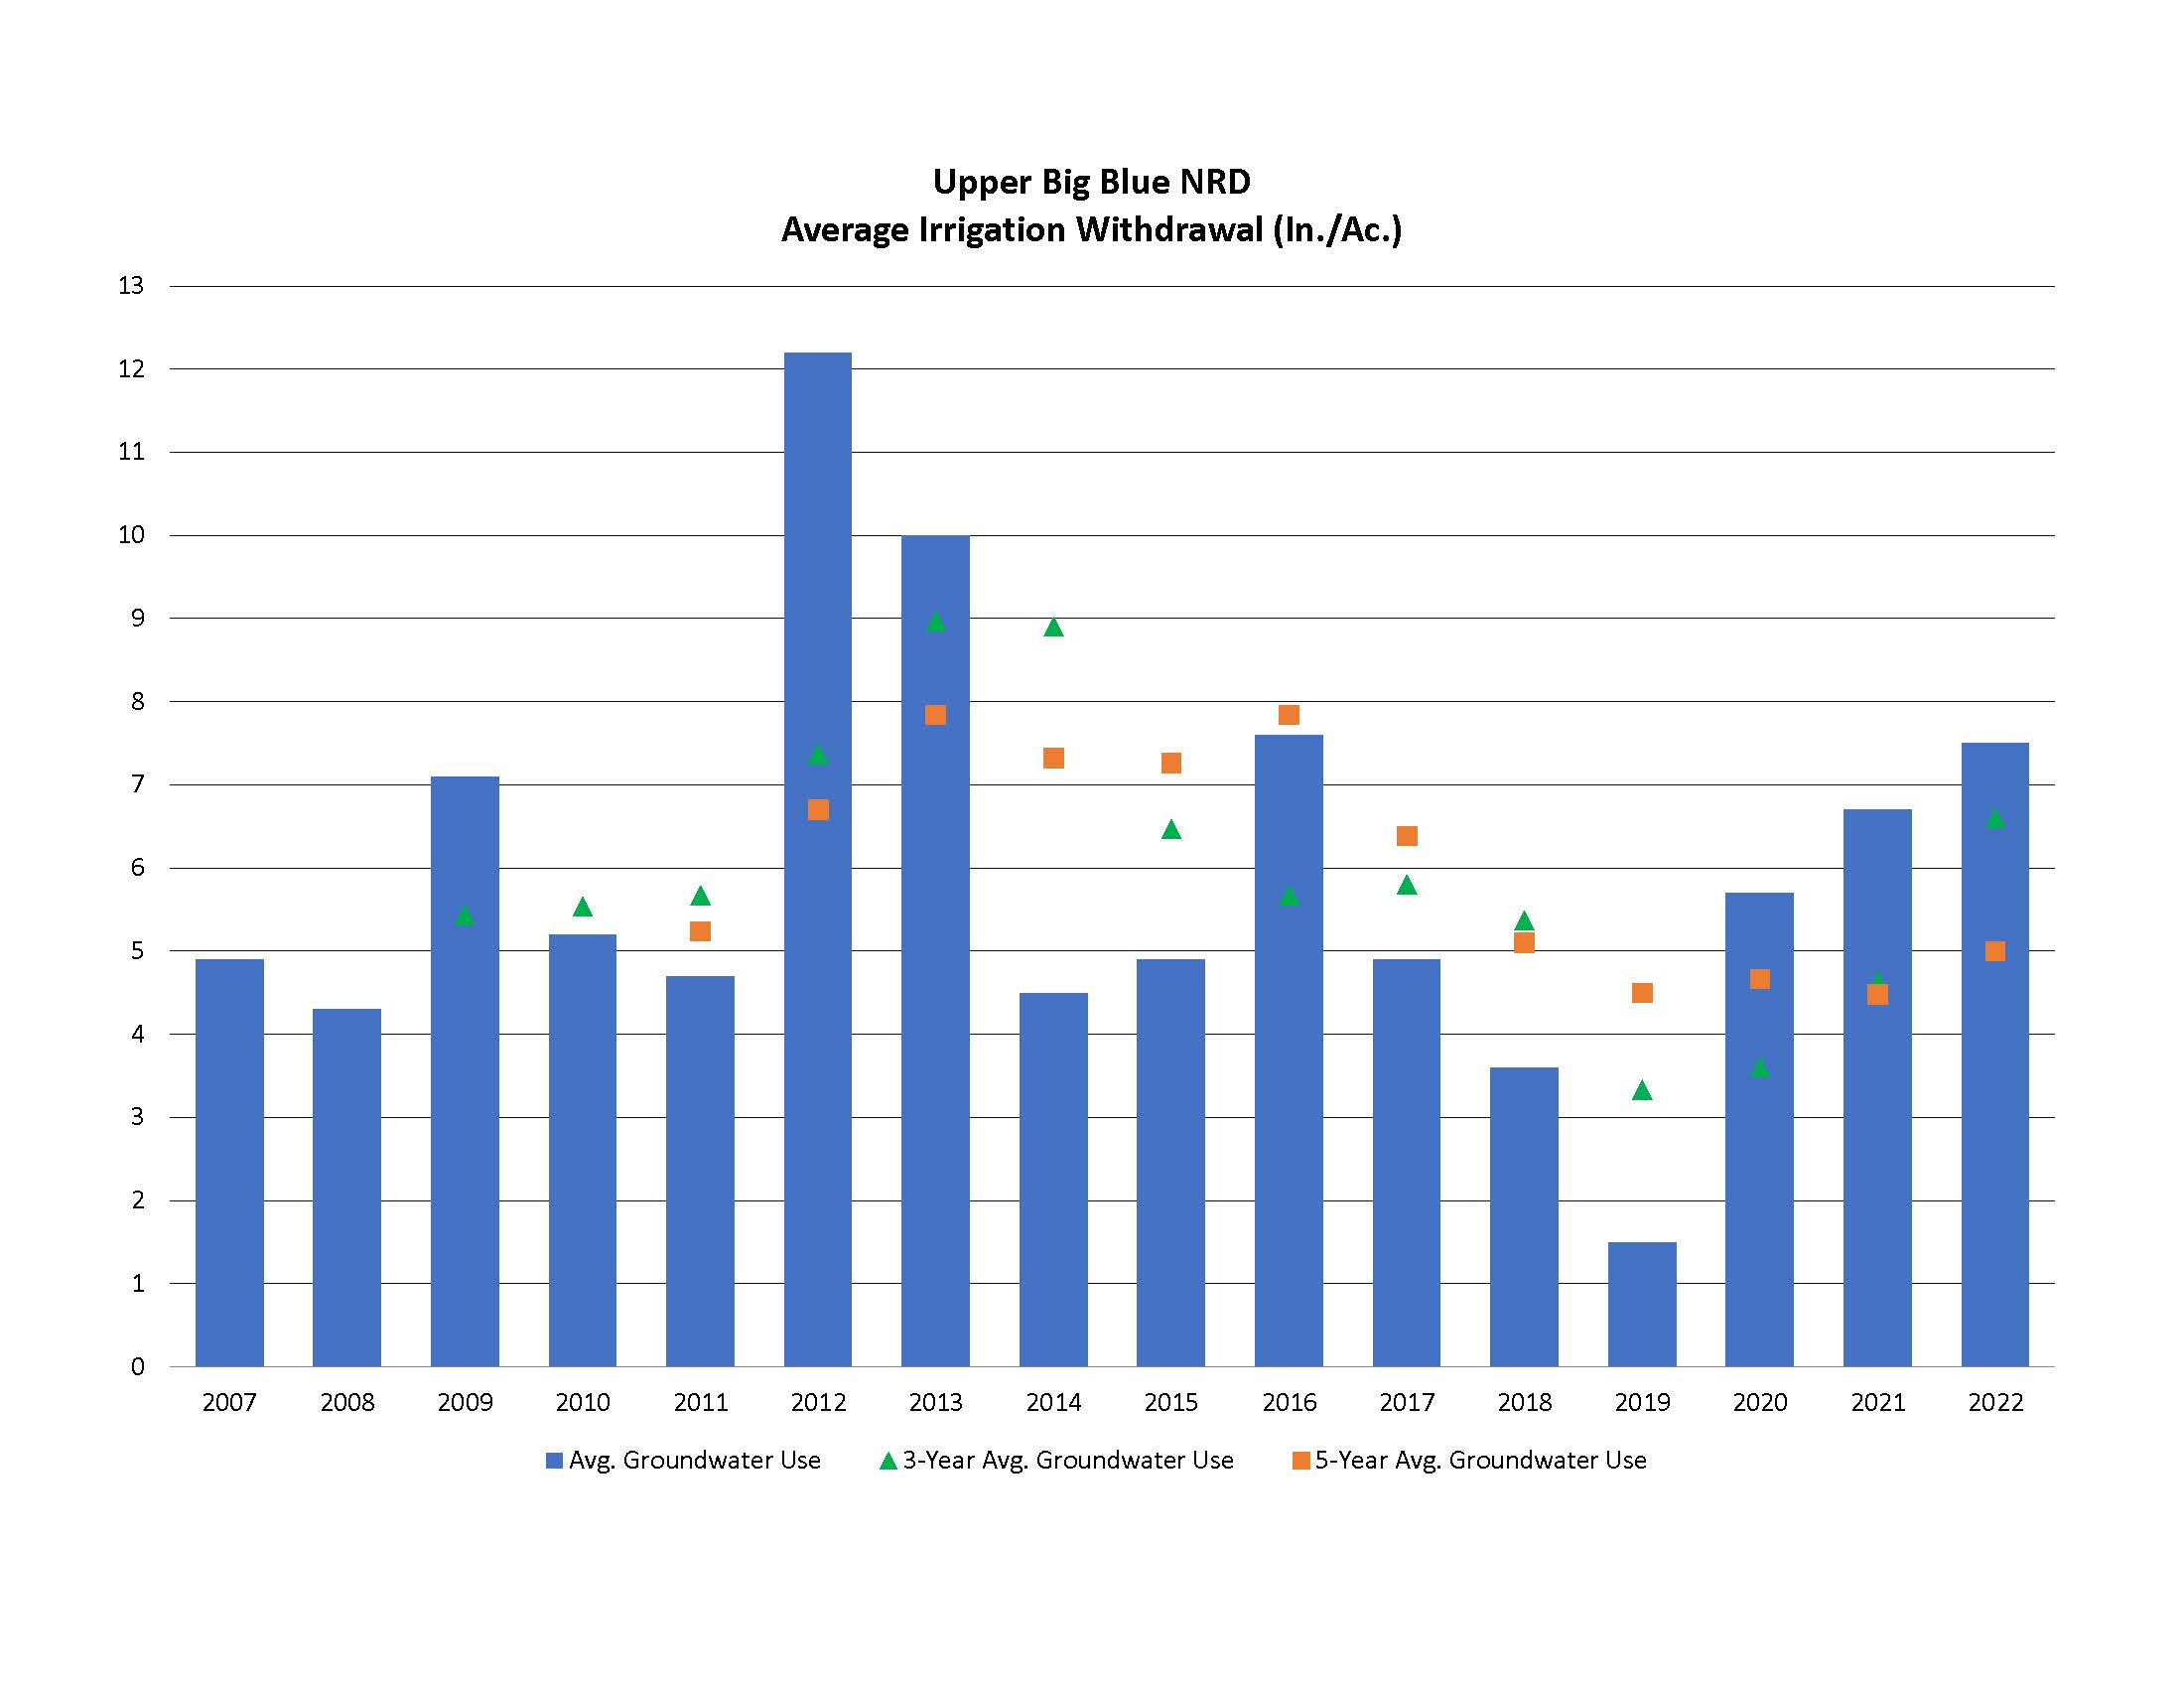
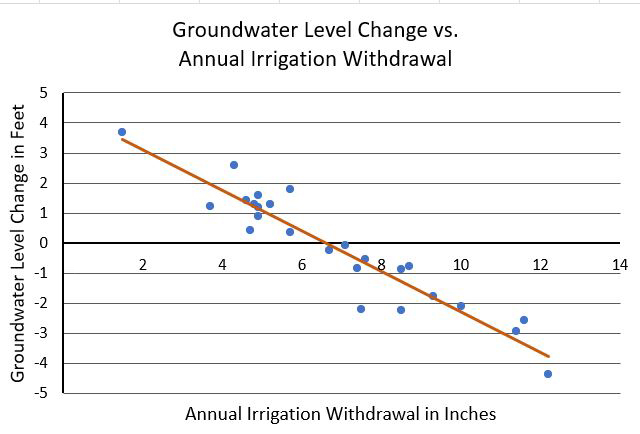
NRD staff also monitor annual water withdrawals and groundwater level changes. When historic data is graphed, it’s observable that if groundwater pumping is held at an average of just below 7 acre inches, there is little fluctuation in groundwater level (see Graph 1 below). During the 2012 pumping season, where in-season rainfall totaled 7.6”*, the average groundwater pumping was 12.2 acre inches, resulting in a groundwater level change of -4.38 feet. Comparatively, in 2022 using the same in-season rainfall data of 17.70”* inches along with the average pumping of 7.5 acre inches, a groundwater level change of -2.21 feet was recorded.
The NRD Board of Directors has safety measures in place to ensure groundwater levels are sustainable for future generations of producers. Part of those safety measures would be the triggering of allocation in the event of prolonged drought conditions resulting in groundwater level declines. Currently, the NRD’s rules and regulations allow for 30 acre inches of irrigation water use over three years for every certified acre in the event that allocation triggers are met. Looking at more than 10 years of data (Graph 2 below), it is evident that most producers in the district would be unaffected by an allocation event at current levels.
For fields where irrigation efficiency could be challenging, there are a number of things that producers can do, especially in a time of water scarcity.
- Upgrade your irrigation equipment: Moving from gated pipe to center pivots can greatly reduce the amount of water you’ll need to apply to raise a healthy crop. Adopting variable rate irrigation allows producers to better distribute irrigation applications across fields with elevation change and soil variability.
- Water at the right time and rate: Corn plants need water throughout the growing season, but they are most sensitive to water stress during the early stages of growth. Applying water too early or too late can reduce yields.
- Add soil health and conservation practices: Improving your soil’s health by moving to no-till farming and adding cover crops will increase your soil’s water infiltration and holding capacity. These practices also prevent soil from drying out rapidly.
- Make data-driven decisions about when to irrigate and how much: Take the guesswork out of irrigation decisions. There are many options available from the NRD and other sources, including low-cost soil moisture sensors.
By using more efficient irrigation practices, growers can save water, reduce costs, and protect the environment.
*Calculated using the York 2W weather station hosted at Recharge Lake from April 1 – September 30.
Graph 1: Annual irrigation withdrawal in the Upper Big Blue NRD plotted against groundwater level change. Based on measured data, the graph shows that if pumping is held to just below 7” annually we see little fluctuation in groundwater level change.
Graph 2: Average irrigation withdrawal in the Upper Big Blue NRD from 2007 to 2022, showing that most producers would be unaffected by allocation limits most years.